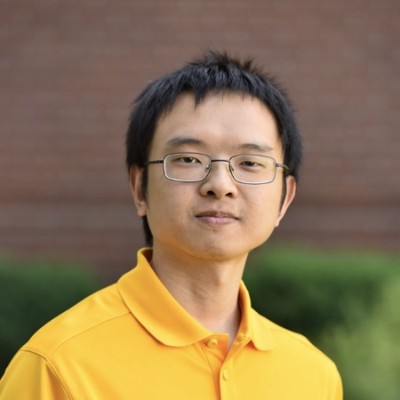
Hong Wang
Senior Software Engineer at Uber
San Francisco Bay Area United States



Summary
🤩
Rockstar🎓
Top SchoolHong Wang is a Senior Software Engineer in the San Francisco Bay Area with 11 years of experience building full-stack systems, data visualizations, and scalable AI platform tooling. At Uber he has driven frontend and platform work—owning visualization and evaluation reporting in Michelangelo and now shaping model packaging and the contract between training pipelines and serving. He contributes to notable open-source projects such as uber/react-vis and uber/manifold, where he improved React visualization components and Jupyter integration for ML model debugging. Holding a PhD in Computer Science from Arizona State University, he blends academic rigor with production-grade engineering and a knack for translating complex data workflows into intuitive interfaces. An underappreciated strength is his end-to-end fluency across visualization design, database management, and platform engineering, which helps teams move models from research to reliable production.
 11 years of coding experience
 8 years of employment as a software developer
 Doctor of Philosophy (Ph.D.) Computer Science, Doctor of Philosophy (Ph.D.) Computer Science at Arizona State UniversityBachelor of Science (B.S.) Computer Science, Bachelor of Science (B.S.) Computer Science at University of Nevada-Las Vegas
 English, Chinese
Github Skills (31)
babel610
data-visualizations10
javascript10
visualization10
python10
charts10
data-visualisation10
chartjs10
charting10
front-end-development10
babel-core10
babeljs10
jupyter-notebook10
data-visualization10
d3js10
Programming languages (2)
Github contributions (5)
uber/manifold
Aug 2019 - Feb 2020
A model-agnostic visual debugging tool for machine learning
Role in this project: Full-stack Developer
Full-stack DeveloperContributions:3 releases, 38 commits, 69 PRs in 6 months
Contributions summary:Hong primarily contributed to the development of the Jupyter notebook integration for the `manifold` tool, focusing on the frontend. They worked on creating and integrating React components, implementing dynamic widget generation, and building the necessary Python bindings. Furthermore, the user refactored the project to leverage a monorepo structure using Ocular. The user added features and maintained the user interface elements and core functionalities of the tool.
debugging-toolvisual-debuggingagnosticmodel-agnosticmachine-learning
uber/react-vis
Dec 2022 - Jan 2023
Data Visualization Components
Role in this project:Front-end Developer
Front-end DeveloperContributions:8 commits, 21 PRs, 18 pushes in 10 days
Contributions summary:Hong primarily contributed to the development and maintenance of React components for data visualization. Their work involved upgrading dependencies such as d3 and canvas, fixing various display issues, and modifying existing components to improve their functionality and responsiveness. Additionally, the user was responsible for enhancing the showcase examples and improving the build process for the browser bundle. They also made changes to the flexible chart implementation.
reactchartcharting-libraryuberdata-visualization
Find and Hire Top DevelopersWe’ve analyzed the programming source code of over 60 million software developers on GitHub and scored them by 50,000 skills. Sign-up on Prog,AI to search for software developers.